JavaScript Performance Optimization Tips: An Overview
In this post, there’s lots of stuff to cover across a wide and wildly changing landscape. It’s also a topic that covers everyone’s favorite: The JS Framework of the Month™.
We’ll try to stick to the “Tools, not rules” mantra and keep the JS buzzwords to a minimum. Since we won’t be able to cover everything related to JS performance in a 2000 word article, make sure you read the references and do your own research afterwards.
But before we dive into specifics, let’s get a broader understanding of the issue by answering the following: what is considered as performant JavaScript, and how does it fit into the broader scope of web performance metrics?
Setting the Stage
First of all, let’s get the following out of the way: if you’re testing exclusively on your desktop device, you’re excluding more than 50% of your users.

This trend will only continue to grow, as the emerging market’s preferred gateway to the web is a sub-$100 Android device. The era of the desktop as the main device to access the Internet is over, and the next billion internet users will visit your sites primarily through a mobile device.
Testing in Chrome DevTools’ device mode isn’t a valid substitute to testing on a real device. Using CPU and network throttling helps, but it’s a fundamentally different beast. Test on real devices.
Even if you are testing on real mobile devices, you’re probably doing so on your brand spanking new $600 flagship phone. The thing is, that’s not the device your users have. The median device is something along the lines of a Moto G1 — a device with under 1GB of RAM, and a very weak CPU and GPU.
Let’s see how it stacks up when parsing an average JS bundle.

Addy Osmani: Time spent in JS parse & eval for average JS.
Ouch. While this image only covers the parse and compile time of the JS (more on that later) and not general performance, it’s strongly correlated and can be treated as an indicator of general JS performance.
To quote Bruce Lawson, “it’s the World-Wide Web, not the Wealthy Western Web”. So, your target for web performance is a device that’s ~25x slower than your MacBook or iPhone. Let that sink in for a bit. But it gets worse. Let’s see what we’re actually aiming for.
What Exactly is Performant JS Code?
Now that we know what our target platform is, we can answer the next question: what is performant JS code?
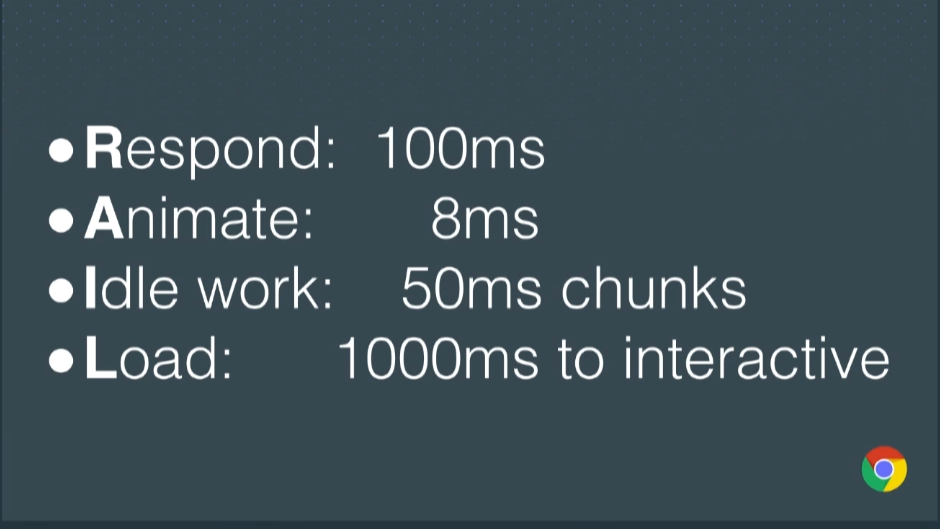
While there’s no absolute classification of what defines performant code, we do have a user-centric performance model we can use as a reference: The RAIL model.

Sam Saccone: Planning for Performance: PRPL
Respond
If your app responds to a user action in under 100ms, the user perceives the response as immediate. This applies to tappable elements, but not when scrolling or dragging.
Animate
On a 60Hz monitor, we want to target a constant 60 frames per second when animating and scrolling. That results in around 16ms per frame. Out of that 16ms budget, you realistically have 8–10ms to do all the work, the rest taken up by the browser internals and other variances.
Idle work
If you have an expensive, continuously running task, make sure to slice it into smaller chunks to allow the main thread to react to user inputs. You shouldn’t have a task that delays user input for more than 50ms.
Load
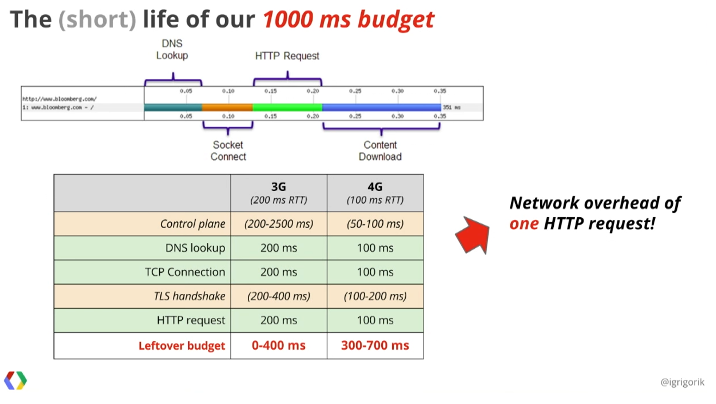
You should target a page load in under 1000ms. Anything over, and your users start getting twitchy. This is a pretty difficult goal to reach on mobile devices as it relates to the page being interactive, not just having it painted on screen and scrollable. In practice, it’s even less:
In practice, aim for the 5s time-to-interactive mark. It’s what Chrome uses in their Lighthouse audit.
Now that we know the metrics, let’s have a look at some of the statistics:
- 53% of visits are abandoned if a mobile site takes more than three seconds to load
- 1 out of 2 people expect a page to load in less than 2 seconds
- 77% of mobile sites take longer than 10 seconds to load on 3G networks
- 19 seconds is the average load time for mobile sites on 3G networks.
And a bit more, courtesy of Addy Osmani:
- apps became interactive in 8 seconds on desktop (using cable) and 16 seconds on mobile (Moto G4 over 3G)
- at the median, developers shipped 410KB of gzipped JS for their pages.
Feeling sufficiently frustrated? Good. Let’s get to work and fix the web. ✊
Context is Everything
You might have noticed that the main bottleneck is the time it takes to load up your website. Specifically, the JavaScript download, parse, compile and execution time. There’s no way around it but to load less JavaScript and load smarter.
But what about the actual work that your code does aside from just booting up the website? There has to be some performance gains there, right?
Before you dive into optimizing your code, consider what you’re building. Are you building a framework or a VDOM library? Does your code need to do thousands of operations per second? Are you doing a time-critical library for handling user input and/or animations? If not, you may want to shift your time and energy somewhere more impactful.
It’s not that writing performant code doesn’t matter, but it usually makes little to no impact in the grand scheme of things, especially when talking about microoptimizations. So, before you get into a Stack Overflow argument about .map vs .forEach vs for loops by comparing results from JSperf.com, make sure to see the forest and not just the trees. 50k ops/s might sound 50× better than 1k ops/s on paper, but it won’t make a difference in most cases.
Parsing, Compiling and Executing
Fundamentally, the problem of most non-performant JS is not running the code itself, but all the steps that have to be taken before the code even starts executing.
We’re talking about levels of abstraction here. The CPU in your computer runs machine code. Most of the code you’re running on your computer is in the compiled binary format. (I said code rather than programs, considering all the Electron apps these days.) Meaning, all the OS-level abstractions aside, it runs natively on your hardware, no prep-work needed.
JavaScript is not pre-compiled. It arrives (via a relatively slow network) as readable code in your browser which is, for all intents and purposes, the “OS” for your JS program.
That code first needs to be parsed — that is, read and turned into an computer-indexable structure that can be used for compiling. It then gets compiled into bytecode and finally machine code, before it can be executed by your device/browser.
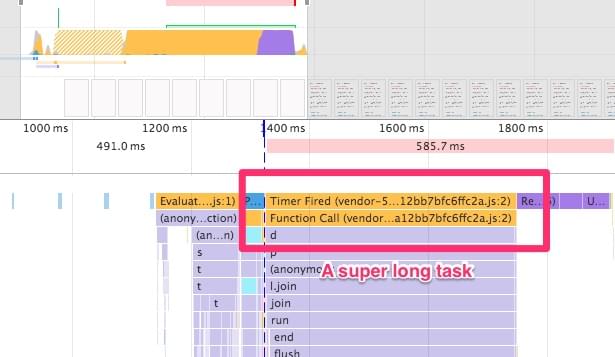
Another very important thing to mention is that JavaScript is single-threaded, and runs on the browser’s main thread. This means that only one process can run at a time. If your DevTools performance timeline is filled with yellow peaks, running your CPU at 100%, you’ll have long/dropped frames, janky scrolling and all other kind of nasty stuff.

Paul Lewis: When everything’s important, nothing is!.
So there’s all this work that needs to be done before your JS starts working. Parsing and compiling takes up to 50% of the total time of JS execution in Chrome’s V8 engine.

Addy Osmani: JavaScript Start-up Performance.
There are two things you should take away from this section:
- While not necessarily linearly, JS parse time scales with the bundle size. The less JS you ship, the better.
- Every JS framework you use (React, Vue, Angular, Preact…) is another level of abstraction (unless it’s a precompiled one, like Svelte). Not only will it increase your bundle size, but also slow down your code since you’re not talking directly to the browser.
There are ways to mitigate this, such as using service workers to do jobs in the background and on another thread, using asm.js to write code that’s more easily compiled to machine instructions, but that’s a whole ’nother topic.
What you can do, however, is avoid using JS animation frameworks for everything and read up on what triggers paints and layouts. Use the libraries only when there’s absolutely no way to implement the animation using regular CSS transitions and animations.
Even though they may be using CSS transitions, composited properties and requestAnimationFrame(), they’re still running in JS, on the main thread. They’re basically just hammering your DOM with inline styles every 16ms, since there’s not much else they can do. You need to make sure all your JS will be done executing in under 8ms per frame in order to keep the animations smooth.
CSS animations and transitions, on the other hand, are running off the main thread — on the GPU, if implemented performantly, without causing relayouts/reflows.
Considering that most animations are running either during loading or user interaction, this can give your web apps the much-needed room to breathe.
The Web Animations API is an upcoming feature set that will allow you to do performant JS animations off the main thread, but for now, stick to CSS transitions and techniques like FLIP.
Bundle Sizes are Everything
Today it’s all about bundles. Gone are the times of Bower and dozens of <script> tags before the closing </body> tag.
Now it’s all about npm install-ing whatever shiny new toy you find on NPM, bundling them together with Webpack in a huge single 1MB JS file and hammering your users’ browser to a crawl while capping off their data plans.
Try shipping less JS. You might not need the entire Lodash library for your project. Do you absolutely need to use a JS framework? If yes, have you considered using something other than React, such as Preact or HyperHTML, which are less than 1/20 the size of React? Do you need TweenMax for that scroll-to-top animation? The convenience of npm and isolated components in frameworks comes with a downside: the first response of developers to a problem has become to throw more JS at it. When all you have is a hammer, everything looks like a nail.
When you’re done pruning the weeds and shipping less JS, try shipping it smarter. Ship what you need, when you need it.
Webpack 3 has amazing features called code splitting and dynamic imports. Instead of bundling all your JS modules into a monolithic app.js bundle, it can automatically split the code using the import() syntax and load it asynchronously.
You don’t need to use frameworks, components and client-side routing to gain the benefit of it, either. Let’s say you have a complex piece of code that powers your .mega-widget, which can be on any number of pages. You can simply write the following in your main JS file:
if (document.querySelector('.mega-widget')) {
    import('./mega-widget');
}
If your app finds the widget on the page, it will dynamically load the required supporting code. Otherwise, all’s good.
Also, Webpack needs its own runtime to work, and it injects it into all the .js files it generates. If you use the commonChunks plugin, you can use the following to extract the runtime into its own chunk:
new webpack.optimize.CommonsChunkPlugin({
  name: 'runtime',
}),
It will strip out the runtime from all your other chunks into its own file, in this case named runtime.js. Just make sure to load it before your main JS bundle. For example:
<script src="runtime.js">
<script src="main-bundle.js">
Then there’s the topic of transpiled code and polyfills. If you’re writing modern (ES6+) JavaScript, you’re probably using Babel to transpile it into ES5 compatible code. Transpiling not only increases file size due to all the verbosity, but also complexity, and it often has performance regressions compared to native ES6+ code.
Along with that, you’re probably using the babel-polyfill package and whatwg-fetch to patch up missing features in older browsers. Then, if you’re writing code using async/await, you also transpile it using generators needed to include the regenerator-runtime…
The point is, you add almost 100 kilobytes to your JS bundle, which has not only a huge file size, but also a huge parsing and executing cost, in order to support older browsers.
There’s no point in punishing people who are using modern browsers, though. An approach I use, and which Philip Walton covered in this article, is to create two separate bundles and load them conditionally. Babel makes this easy with babel-preset-env. For instance, you have one bundle for supporting IE 11, and the other without polyfills for the latest versions of modern browsers.
A dirty but efficient way is to place the following in an inline script:
(function() {
  try {
    new Function('async () => {}')();
  } catch (error) {
    // create script tag pointing to legacy-bundle.js;
    return;
  }
  // create script tag pointing to modern-bundle.js;;
})();
If the browser isn’t able to evaluate an async function, we assume that it’s an old browser and just ship the polyfilled bundle. Otherwise, the user gets the neat and modern variant.
Conclusion
What we would like you to gain from this article is that JS is expensive and should be used sparingly.
Make sure you test your website’s performance on low-end devices, under real network conditions. Your site should load fast and be interactive as soon as possible. This means shipping less JS, and shipping faster by any means necessary. Your code should always be minified, split into smaller, manageable bundles and loaded asynchronously whenever possible. On the server side, make sure it has HTTP/2 enabled for faster parallel transfers and gzip/Brotli compression to drastically reduce the transfer sizes of your JS.
And with that said, I’d like to finish off with the following tweet:
So it takes a *lot* for me to get to this point. But seriously folks, time to throw out your frameworks and see how fast browser can be.
— Alex Russell (@slightlylate) September 15, 2016

