Debug WebGL and HTML5 Mobile Experiences with Visual Studio Emulators

This article is part of a web development series from Microsoft. Thank you for supporting the partners who make SitePoint possible.
With the recent availability of Visual Studio 2015 RTM came the free Visual Studio Emulator for Android. In this article, I’ll show you how to test your WebGL experiences on these very fast Android emulators.
First, download Visual Studio 2015 RTM (such as the free community edition) or install the Android emulators directly without Visual Studio. Then, read Introducing Visual Studio’s Emulator for Android, which explains how this cool emulator works and the features supported.
Note: I recently published an article describing how to remotely debug and profile the performance of HTML5 websites and apps on Windows Phone. You can now use the same approach to debug Windows Mobile 10 and Mobile Edge with the release of the Windows 10 SDK Tools.
WebGL testing
Once installed, you can launch the tool:
And choose the image you’re interested in:
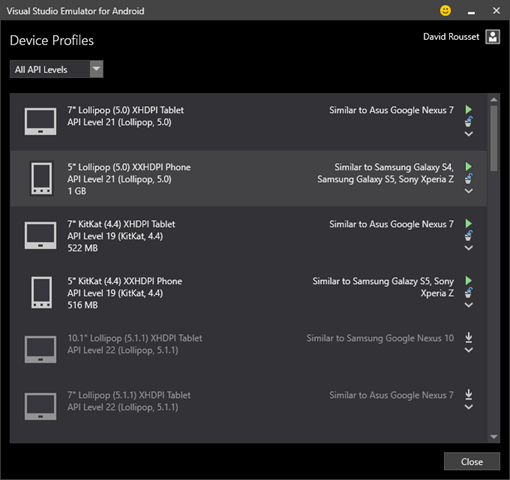
Let’s choose “5″ Lollipop (5.0) XXHDPI Phone – Similar to Samsung Galaxy S4” and press play. If it’s the first time you’re launching the emulator, it will configure the Hyper-V network settings for you.
Once started, launch the default installed browser and try, for instance, to navigate to http://www.babylonjs.com/, the best available WebGL framework to date . If you try to launch one of our scenes, you’ll see an error:
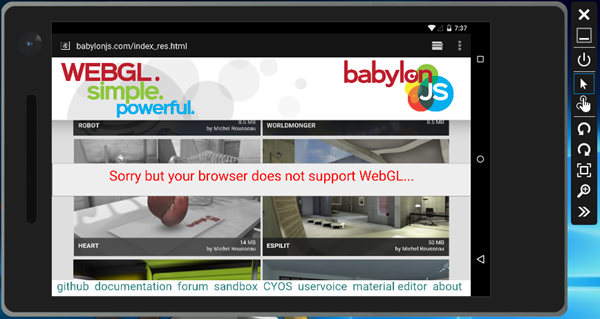
Indeed, the default browser shipped with this Lollipop image doesn’t support WebGL. We need to install Chrome on it.
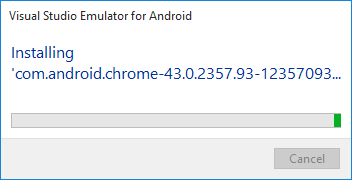
Search for an x86 version of the Chrome APK such as this one: Chrome 43.0.2357.93 (x86) and drag’n’drop the APK directly into the emulator. It should install it:
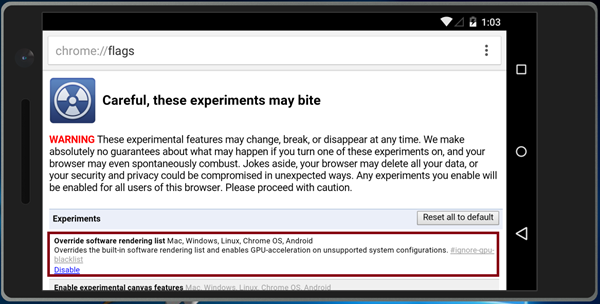
But if you’re navigating again to the same URL with Chrome, you will still have the same error. This time, it’s because Chrome hasn’t enabled WebGL as the emulator—it is not part of his whitelist. To force it, navigate to “about:flags” and enable this option: Override software rendering list.
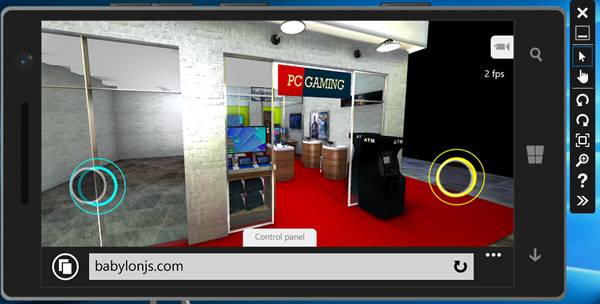
You should now be able to launch one of our scenes such our famous Espilit scene: http://www.babylonjs.com/index.html?ESPILIT/
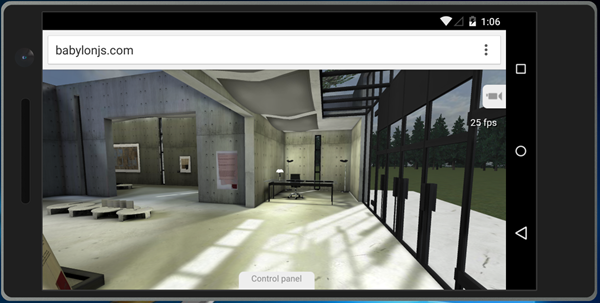
25 fps on my first gen Lenovo X1 using a simple HD4000 GPU on Windows 10! Not bad for an emulator! Obviously, you still need a real device to benchmark performances of your WebGL code.
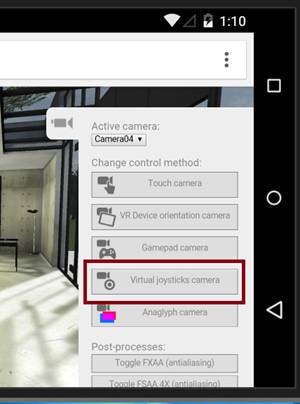
Even better, as the emulator is perfectly supporting touch, you can also test and debug multi-touch inside your WebGL experiences. For instance, switch the camera to “Virtual joysticks camera”:
You can now move into the 3D scene using two of your fingers by simply touching your PC screen:
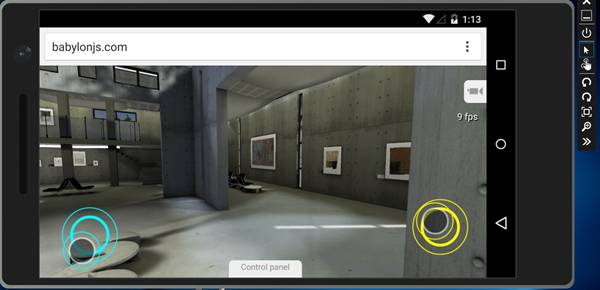
Note: for that, we’re using Pointer Events and our HandJS polyfill to propagate those events to Touch Events as Chrome is not supporting Pointer Events yet.
On Windows Phone/Mobile, WebGL is enabled by default in IE11 and Edge. So simply launch the Windows Phone emulator and navigate to your WebGL content.
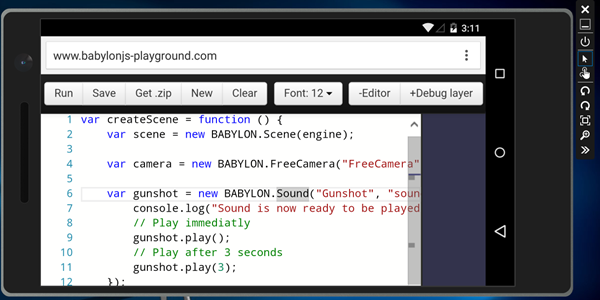
Note: Even Web Audio is supported by Chrome inside the Visual Studio emulator! For instance, this demo works in it: http://www.babylonjs-playground.com/index.html?22
Going further with Vorlon.js
We made Vorlon.js initially to simplify the life of mobile web developers. If you haven’t heard of it yet, feel free to have a look to the video on our website: http://www.vorlonjs.io/ and check this article: Why we made vorlon.js and how to use it to debug your JavaScript remotely
Let’s first review how to debug your layer on Android and Windows Phone emulators. For instance, I’m currently playing with Flexbox during my spare time to improve the Babylon.js website. Thanks to the Modernizr plug-in, you can see that Flexbox is supported by the emulator and you can even review the layout size via the DOM Explorer:
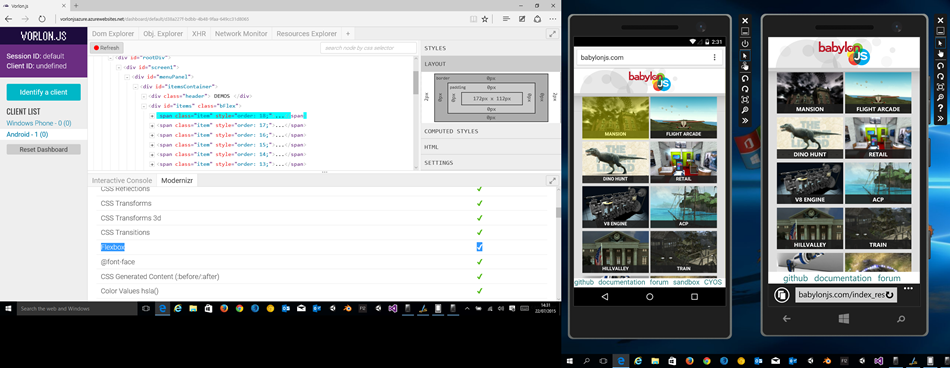
For instance, you see in the Android emulator (on the left) the “Mansion” flexbox item highlighted, its size is currently 172px x 112px.
Let’s review the same site on the Windows Phone emulator (on the right):
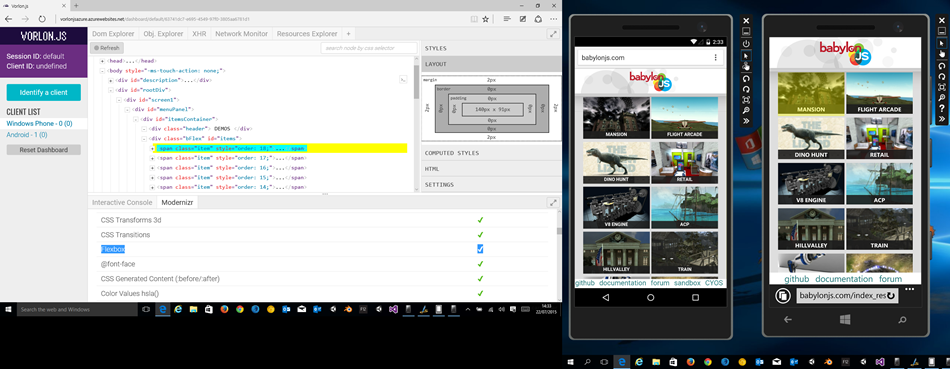
Of course, Flexbox is also supported by IE11 Mobile and this time, the same flexbox item is currently 140px x 91px.
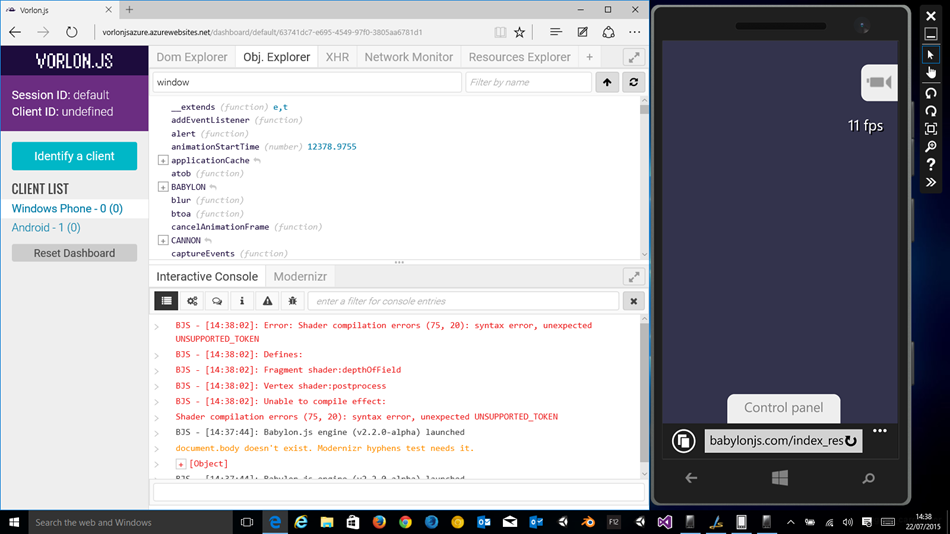
Another interesting feature is the interactive console. Sometimes, using WebGL, it’s hard to know why your code failed on a mobile device. This is often because the mobile’s GPU is not supporting a specific feature or because a shader doesn’t compile. This is, for instance, the case of our “Depth of field / end” demo. The shader is too complex for Windows Phone and you can simply verify it with our tool:
We’ve got plenty other plugins that could help you and we’re currently working in adding new one to even go further. And who knows, we will maybe have one for babylon.js in a near future.
More hands-on with JavaScript
This article is part of the web development series from Microsoft tech evangelists on practical JavaScript learning, open source projects, and interoperability best practices including Microsoft Edge browser and the new EdgeHTML rendering engine.
We encourage you to test across browsers and devices including Microsoft Edge – the default browser for Windows 10 – with free tools on dev.modern.IE:
- Scan your site for out-of-date libraries, layout issues, and accessibility
- Use virtual machines for Mac, Linux, and Windows
- Remotely test for Microsoft Edge on your own device
- Coding Lab on GitHub: Cross-browser testing and best practices
In-depth tech learning on Microsoft Edge and the Web Platform from our engineers and evangelists:
- Microsoft Edge Web Summit 2015 (what to expect with the new browser, new supported web platform standards, and guest speakers from the JavaScript community)
- Woah, I can test Edge & IE on a Mac & Linux! (from Rey Bango)
- Advancing JavaScript without Breaking the Web (from Christian Heilmann)
- The Edge Rendering Engine that makes the Web just work (from Jacob Rossi)
- Unleash 3D rendering with WebGL (from David Catuhe including the JS and babylonJS projects)
- Hosted web apps and web platform innovations (from Kevin Hill and Kiril Seksenov including the JS project)
More free cross-platform tools & resources for the Web Platform: