Debugging CSS for UI Responsiveness
The following is an extract from our book, CSS Master, written by Tiffany Brown. Copies are sold in stores worldwide, or you can buy it in ebook form here.
CSS properties and values that trigger reflows are particularly expensive. They can slow user interface responsiveness―page rendering, animation smoothness, and scroll performance―especially on low-powered devices such as phones and smart TVs.
What is a reflow? {.title}
A reflow is any operation that changes the layout of part or all of a page. Examples include changing the dimensions of an element or updating its left position. They’re because they force the browser to recalculate the height, width, and position of other elements in the document.
Repaints are similar to reflows in that they force the browser to re-render part of the document. Changing the color of a button when in a :hover{.literal} state is one example of a repaint. They’re a bit less troublesome than reflows because they do not affect the dimensions or position of nodes; however, repaints should still be kept to a minimum.
Reflows and repaints are most often triggered by DOM operations; for example, adding to or removing elements. But they can also be caused by changes to properties that affect the dimensions, visibility, or position of an element. This is true whether the change is caused by JavaScript or a CSS-based animation.
Note: Page Loads {.title}
Page loads will always trigger reflow and repaints as the browser parses the initial HTML, CSS, and JavaScript.
It’s difficult to completely banish repaints and reflows from a project. We can, however, identify them and reduce their impact using timeline tools.
Timeline Tools {.title}
Timeline tools are a bit befuddling at first. They measure the performance of your front end, capturing how much time it takes for various tasks to complete. By recording activity while interacting with our pages, we can spot what lines of our CSS may be causing performance bottlenecks.
To use the timeline, click the timeline tab in the developer tools interface. In Chrome, Opera, and Firefox, it’s appropriately named Timeline. Safari makes it plural, so it’s Timelines. Internet Explorer 11 uses the more descriptive UI Responsiveness.[9]
In any browser, press the Record button to start the recording process. Interact with the problematic portions of the page and, when you’re done, click the appropriate button to stop recording.
Depending on which browser you use, you may see data immediately or after you stop recording. Safari and Firefox display data in real time, while Chrome, Opera, and Internet Explorer render a performance chart after you stop recording.
Document loads, function calls, DOM events, style recalculations, and paint actions are all logged in every browser, giving us an overview of performance bottlenecks. What we’re looking for, at least as far as CSS performance is concerned, are two related aspects:
-
large numbers of style recalculation and paint operations
-
operations that take a long time, as indicated by larger blocks in
the timeline
To see what this looks like in practice, we’ll compare two basic documents, Examples A and B. In both cases, we’re moving a series of div{.literal} elements from an x-position of zero to an x-position of 1,000. Both examples use CSS transitions. In Example A, however, we’re going to animate the left{.literal} property. In Example B, we’re going to use a translation transform and animate the transform{.literal} property.
Our markup for both is the same (the result can be seen in Figure 3.16):
<!DOCTYPE html>
  <html lang="en-US">
  <head>
    <meta charset="utf-8">
    <title>Performance example</title>
    <style type="text/css"
     > /* CSS will go here. */
    </style>
 </head>
 <body>
  <button type="button" id="move">Move</button>
<div></div>
<div></div>
<div></div>
<div></div>
<div></div>
<div></div>
<div></div>
<div></div>
<div></div>
<div></div>

<script type="text/javascript" src="toggle-move-class.js"> ↵</script>
</body>
</html>
Figure 3.16. Our HTML demo page of div elements in Safari
Our JavaScript for both documents is also the same. Clicking the Move button toggles the moved{.literal} class on each div{.literal} element:
var move = document.getElementsById('move');
move.addEventListener('click', function(e) {
    var objs = document.body.querySelectorAll('div');
    Array.prototype.map.call(objs, function(o){
        o.classList.toggle('moved');
    });
});
Our CSS is where matters diverge. The CSS used in Example A follows:
div {
  background: #36f;
  margin-bottom: 1em;
  width: 30px;
  height: 30px;
  position: relative;
  left: 0;
 transition: left 2s ease-in;
}

.moved {
    left: 1000px;
}
When triggered, this animation will generate a lot of style calculation and repaint indicators in our timeline. The images that follow show timeline output for this transition in Safari (Figure 3.17), Chrome (Figure 3.18), Internet Explorer (Figure 3.19), and Firefox (Figure 3.20)
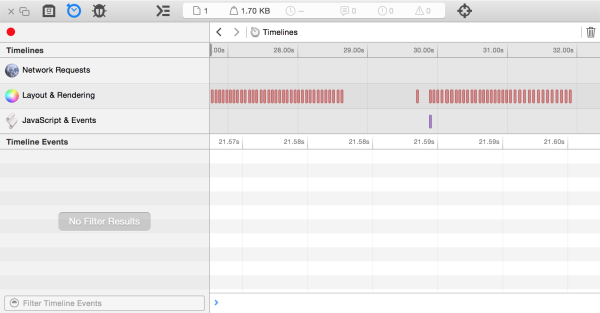
Figure 3.17. Safari timeline output for left-position transition
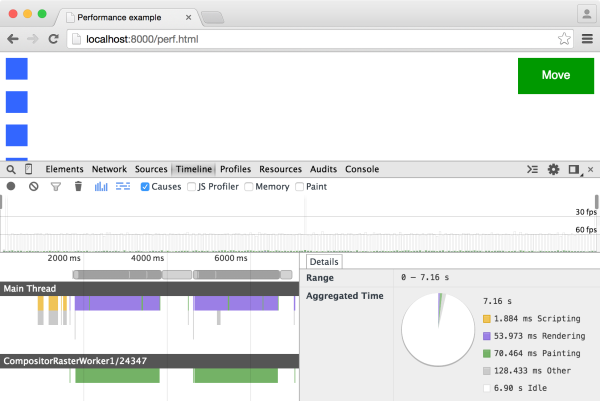
Figure 3.18. The same again in Chrome
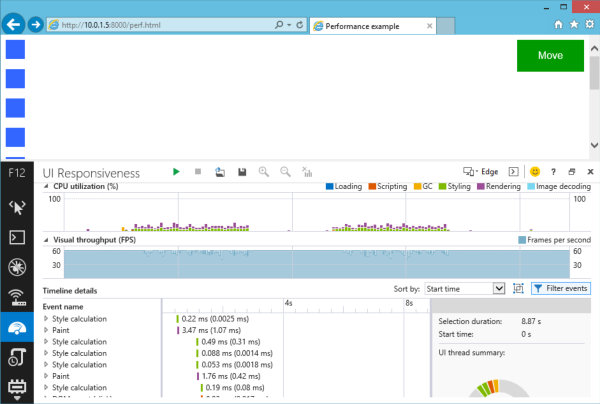
Figure 3.19. Internet Explorer 11 timeline output for left-position transition
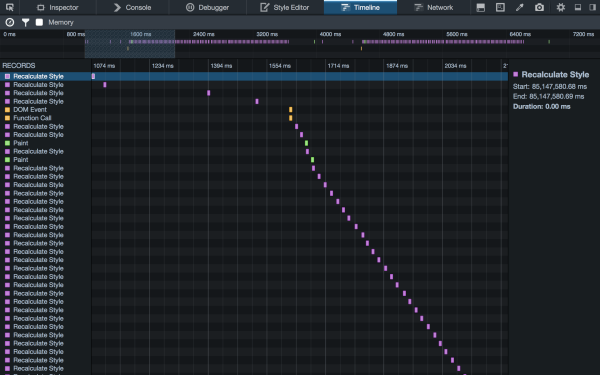
Figure 3.20. And how it looks in Firefox
The reason for the style calculations and repaints has to do with the property we’re transitioning: left{.literal}. The left{.literal} property triggers a reflow whenever it is changed, even if that change is caused by an animation or transition.
Now, let’s take a look at the CSS for Example B:
div {
  background: #f3f;
  margin-bottom: 1em;
  width: 30px;
  height: 30px;
  position: relative;
  left: 0;
  transition: transform 2s ease-in;
  transform: translateX(0);

}

.moved {
    transform: translateX(1000px);
}
Here we’re using a transform and transitioning between translateX(0){.literal} and translateX(1000px){.literal}.
In most browsers, transforms don’t trigger reflows, and our timelines will contain far fewer repaint operations. This is evident in Safar (Figure 3.21), Chrome (Figure 3.22), and Internet Explorer (Figure 3.23). Firefox is the exception here; compare Figure 3.20 to Figure 3.24. The timelines for a left transition and a translation transformation are very similar.
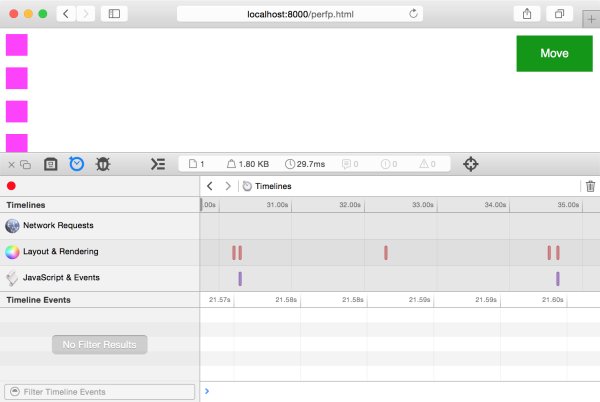
Figure 3.21. Safari timeline output for a transition of the -webkit-transform property
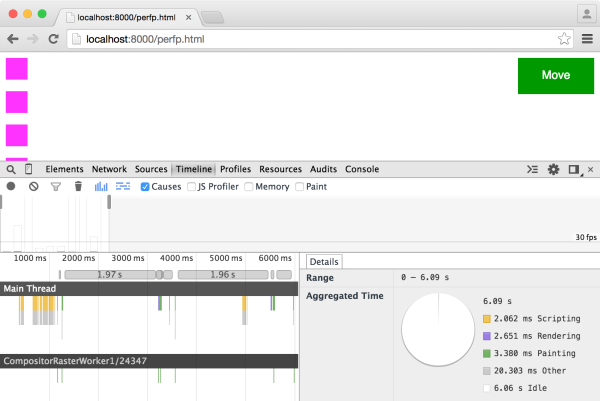
Figure 3.22. The same for Chrome, this time utilizing the transform property
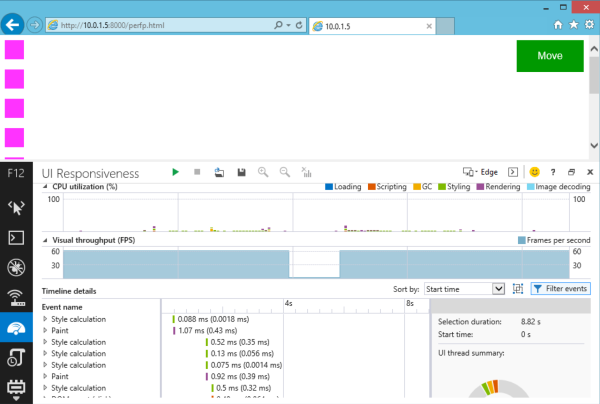
Figure 3.23. How it looks in Internet Explorer 11
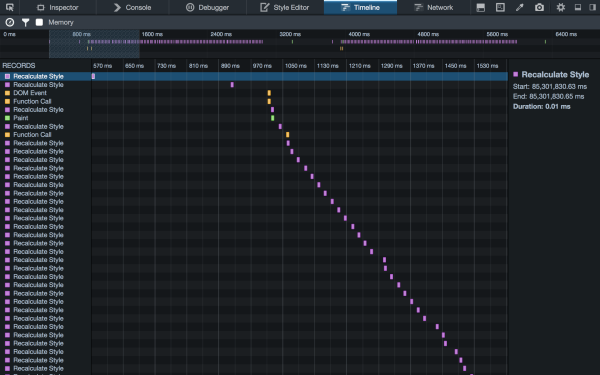
Figure 3.24. Firefox timeline output for a transition of the transform property
Identifying Lines to Remove {.title}
Unfortunately, there is no definitive list of which properties cause reflows and repaints. Paul Lewis’ CSS Triggers comes closest, but it’s Chrome-specific. Browsers do behave similarly for many of these properties, however, so this resource will at least give you an idea of what properties may be causing trouble.
Once you know which properties could be problematic, the next step is to test the hypothesis. Disable that property―either with a comment or by adding a temporary x-{.literal} prefix―and rerun the timeline test.
Remember that performance is relative, not absolute or perfect. The goal is improvement: make it perform better that it did before. If a property or effect is performing unacceptably slow, eliminate it altogether.
