Optimizing Bounce Rates with FullStory’s Session Replay Tool

“Insights” are the de facto word of choice when it comes to analytics — and for good reason. Teams need to know critical information about their product, users, website performance (and more) to make decisions.
When it comes to web analytics, the typical insights are metrics that are built around clicks and taps, page visits, session durations, bounce rates, conversion rates, and other aggregated data points. These metrics are useful for diagnosing problems (or spotting opportunities) relating to UX or otherwise, but once identified, this is often where teams get stuck.
The solution to this data quandary is to have a way to “zoom in” on an identified issue to see what’s going on, learn more, and then come up with viable solutions. This hybrid, quantitative-qualitative strategy takes advantage of both diagnostic and descriptive analytics tools. But just how does it work, in practice? And what kinds of insights can be discovered?
In this article, we’ll be focusing on bounce rates, looking specifically at how a bounce rate can be used as a way to identify opportunities for search engine optimization, app copy optimization, landing page optimization (including identifying fake paid traffic), and overall UX optimization.
Bounce rates mean something — but what?
If you’re wondering how the qual-quant strategy works in real life, consider one of the most commonly used metrics in web analytics: the bounce rate.
As a refresher, a bounce is defined as “a session that triggers only a single request to the analytics server, such as when a user opens a single page on your site and then exits without triggering any other requests to the analytics server during that session”. (Source: Google Analytics.)
Bounce rates are bad, right? Well, as Google Analytics explains on its help page, “it depends.” The thing about bounce rates is that, while they might point to something going wrong, or signal the relative performance of different traffic sources, or sub-optimal UX, they tell you next to nothing about what is actually working (or not working) on the page.
Using bounce rates as a signal of high- or low-performing web pages and then analyzing those pages using a session replay tool like FullStory can help provide the needed answers to optimize the page.
Here’s how it works.
Optimizing UX with Bounce Rates and FullStory
First, identify underperforming pages using Google Analytics (or your preferred analytics platform). Then, search for session recordings on those pages in FullStory using the URL in question as your segmenting parameter. You can then refine your results further, based on other criteria (such as sessions referred from a specific URL, or visits with a duration of 60 seconds or less).
You can also cut your search by sessions that contain signals of user frustration. At FullStory, we call these “Rage Clicks”.”
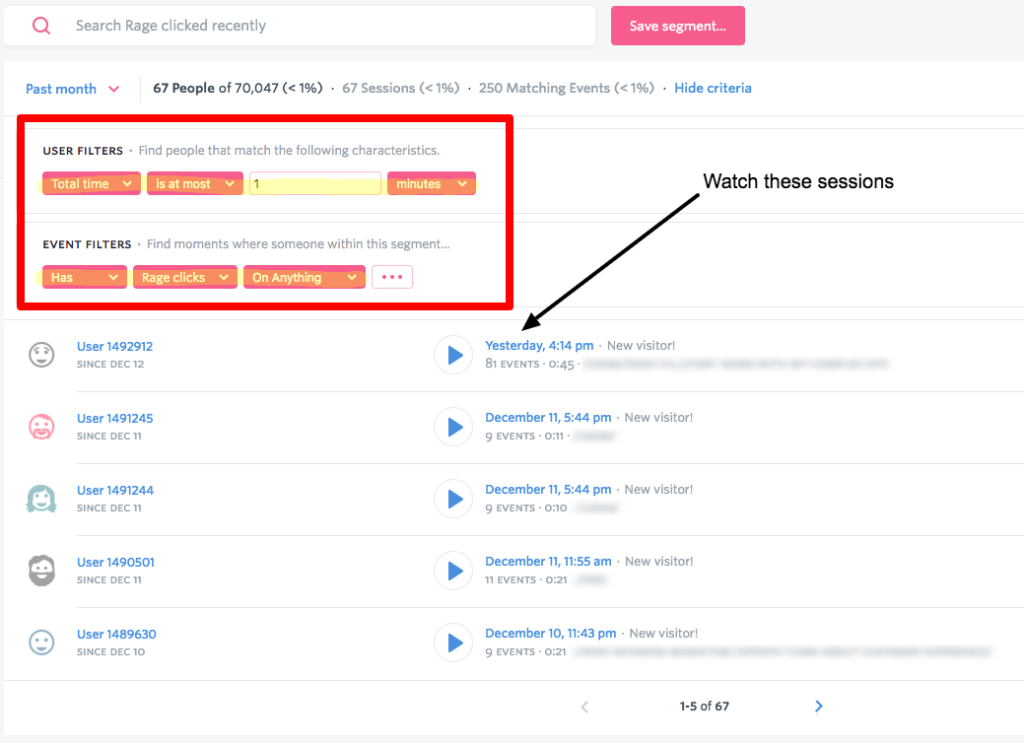
You can search in FullStory for all sessions that contain Rage Clicks.
Once you have a list of sessions to watch, set aside an hour to make observations. Take notes in a spreadsheet of any surprising behaviors:
- What’s being clicked — or not clicked?
- Where does user attention seem to drop?
- Is anything on the page breaking?
- Are key elements being obscured?
As you make observations, take notes in a spreadsheet. After an hour — or once you hit a point of diminishing returns — review your notes and see if any trends appear. After a while, this qualitative analysis will lead to a couple immediate improvements and a handful of ideas about how to optimize the user experience. Execute the immediate improvements and use your ideas (and a handy A/B testing tool) to experiment.
Sounds simple, right? But does this work in all cases?
Optimizing SEO with FullStory
The Google search algorithm uses many signals to assess the relevance of content to a specific query. One of them is whether or not a user has to return to their Google search after clicking a specific result. Example: imagine you search for “bounce rate” and land on a site talking about basketballs. Not very relevant; you click back and go to another Google search result. Google sees that and factors it into future search results.
While it’s impossible to match a specific session to a specific Google search, you can use Google Analytics and Google Search Console to identify the top performing web pages by search position, CTR, impressions and so on.
- Note the bounce rates of your top 5–10 pages by visits in Google Analytics (or whatever quantitative analytics tool you use).
- Create a list of web pages that have significantly higher bounce rates. Focus on those web pages you’d like to optimize for search.
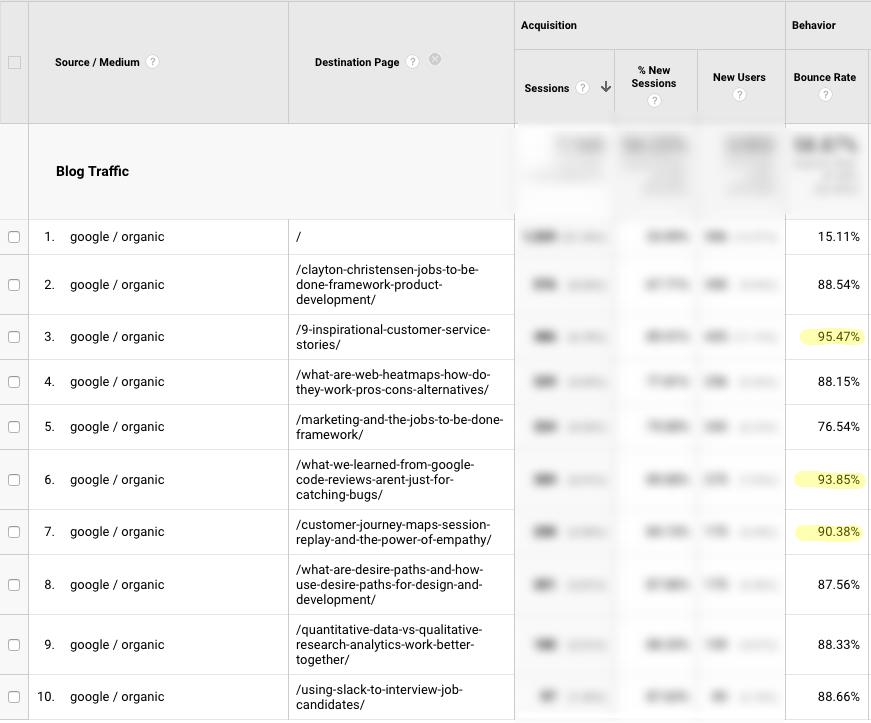
In Google Analytics, you can pull up Google/organic referrals and add a second dimension of Destination Page. You can also prioritize based on bounce rate. Pick pages that have poor bounce rates to investigate further in FullStory.
Take this list and search in FullStory for sessions containing visits to these highly popular pages. Filter the resulting list of sessions further based on visits that were referred by Google. Get even more specific by filtering your sessions to those that are short (say, 30 seconds or less).
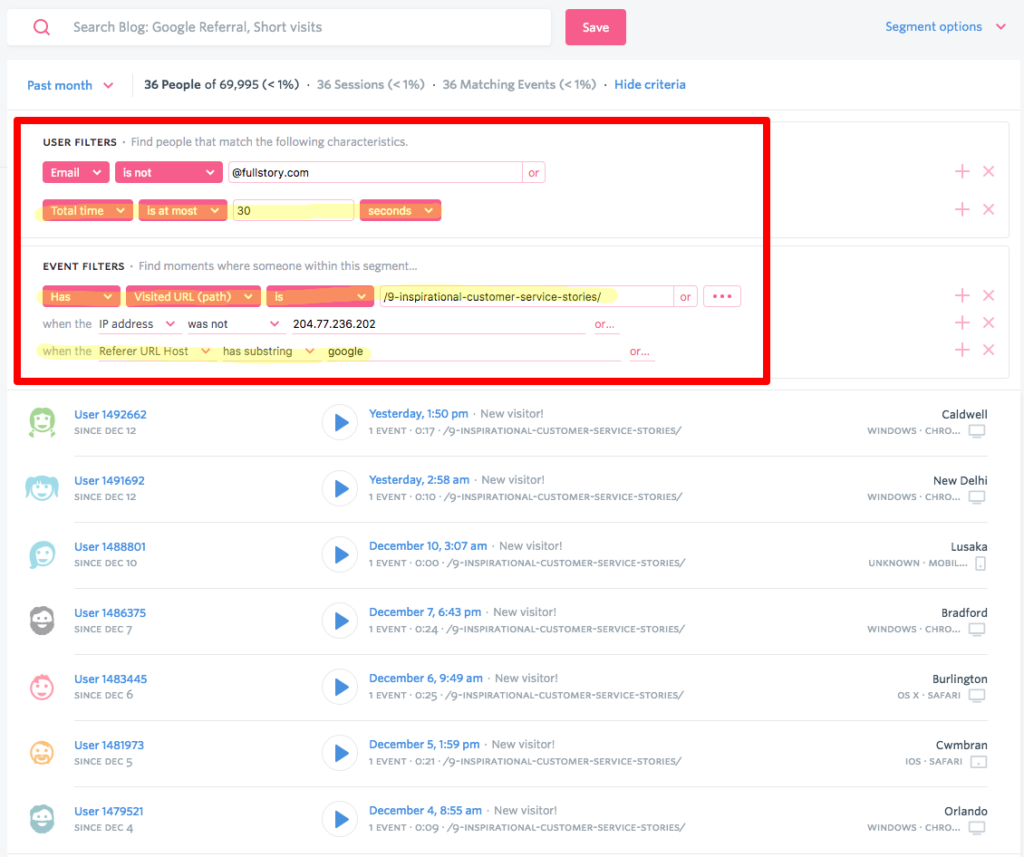
Above in FullStory we create a search for sessions in which the total time is 30 seconds, the referral source is Google, and the landing page is a piece of content we want to optimize. Watch these sessions to see where things might be going wrong.
Before you dive into watching sessions, put yourself in your user’s shoes. They’re using a set of keywords to search for an answer. What might those keywords be? How would that search affect your consumption of the page?
Now replay sessions from your list. Observe how the user is taking in the content. See if you can determine what they are looking for based on where they pause or what they highlight. Finally, what did they do immediately before bouncing? Somewhere in that moment lies your issue.
Having watched a number of sessions to this blog article on FullStory, we noticed that many users were dropping off after the first story in our list. We’ll see if we can be more engaging, so that readers stick around longer.
Once you get a feel for how these bouncing visitors behave, make a list of changes to test going forward. You may realize your intro is too long or some graphic is distracting. Perhaps something else entirely. If you make changes based on your observations, take notes of what you changed, and then return to your quant tool after a significant amount of time and see if you’ve improved bounce rates and/or your presence in organic search.
The same concept applies to improving UX for conversions as well.
Optimizing Paid Traffic to Landing Pages
If you’re sending paid traffic to your website, you likely use your quantitative analytics tool to see how well those visits perform. Simply looking at bounce rates (and conversion rates) might tell you when a campaign is a bust, but they don’t quite answer why (and we need to be learning from mistakes if we are do better next time).
This is because paid visits could perform badly for all sorts of reasons. Assuming you’re advertising to the right audience (a significant assumption), on-page optimizations are the most likely culprits of a high bounce rate. Everything from poor landing page design to hidden calls to action or overly long page copy could all hurt your bounce rate.
No matter what approach is taken, the basic strategy remains the same.
Browse sessions in FullStory, and create a list of those containing paid visits to your landing page. Refine the list to include sessions that are short. Replay sessions, make observations, and walk away with a handful of direct improvements — or things to test. If you’re using A/B testing tools to trial solutions, refine the variations based on your replay insights.
Rinse, repeat!
Unless, that is, the paid traffic to your landing page isn’t real. You Exec used FullStory session replay to analyze paid traffic from Google and Facebook. What You Exec found was that 90% of Google and Facebook ad traffic appeared to be useless (bots?). They were able to spot the difference by comparing sessions from real users to suspected sessions from bots:

A screenshot of You Exec’s GIF recording. If you check out the real version, you see it shows the natural cursor movements and human-like scrolling behavior (playback sped up 3x faster than actual). The fake version shows that the interaction is non-existent and the time is mostly spent idling.
While diagnostic web analytics tools can hint that there’s a problem with a particular traffic source, the only way to be sure is to use something more human. And for that, FullStory’s session replay works like a charm.
Eliminating Confusing Copy with FullStory
We’ll end with a bounce rate case study that illustrates how mysterious bounce rates may have nearly impossible to determine causes without the answers provided by a descriptive analytics tool.
Appcues, an onboarding and in-app messaging tool, noticed elevated bounce rates on their signup form. On taking a closer look by replaying sessions in FullStory, they noticed user confusion on clicking a submit button. Upon clicking the button, the copy changed from Create your first experience to Warming up our engines.
From observing sessions, Appcues deduced that the copy Warming up our engines confused users. They didn’t understand what it meant. The change was simple. Appcues changed the post-click copy to Thanks! You’ll be redirected in a sec, and quickly saw an increase in activation rates. Such a silly mistake, yet such a simple solution.
Less Bounce, More Play!
Quantitative analytics tools like Google Analytics are incredibly useful for identifying problems and opportunities. But these high-level insights are only the beginning: you need a qualitative analytics tool to dig deeper.
FullStory is that kind of tool. Search for and replay the actual, individual user sessions driving those high bounce rates. Make observations, hypothesize solutions, and improve your site based on real observations!