How to Analyze Heatmaps and Create A/B Tests with Crazy Egg

Once upon a time, having an online business was about just having a website. But now, online businesses are growing larger, moving faster, and becoming more complex by the day. What was once a way to say “this is who we are and this is what we do”, is now an opportunity for a variety of different business models — subscriptions, services, products and so on.
In order to attain these conversions, you need to be using the right tools for your business — tools that allow you identify where your website is falling short in terms of UX, and then correct it with a viable solution. Heatmap and A/B testing tools are essential for this, and they help you to understand your users, scale your business, and make UX better.
What Are Heatmaps?
Heatmaps tell a story about your website. A heatmap will track the activity of the users on your site much like Google Analytics will, but its focus will be on the movement of your visitors through their mouse clicks and scroll activity via screen recording. Where Google Analytics can tell you what’s happening, heatmaps can show you why.
What Is A/B Testing?
A/B testing tools allow you to try out different variations of your website (or even individual elements), to see which converts best. While heatmaps can identify where and why users are getting confused, A/B testing can then help you play with some solutions. That’s why having both of these features in a single app is a winning idea. Enter Crazy Egg.
Getting Started with Crazy Egg
Once you’ve created your Crazy Egg account, head here to acquire your tracking code. This tracking code records your users’ activity, and represents this data with analytics, heatmaps and screen recordings. The JavaScript snippet that Crazy Egg creates for you needs to be inserted into the <head> section of your websites’ code. After that, we can read the data.
The Three Different Types of Heatmaps
Crazy Egg creates three different types of heatmaps.
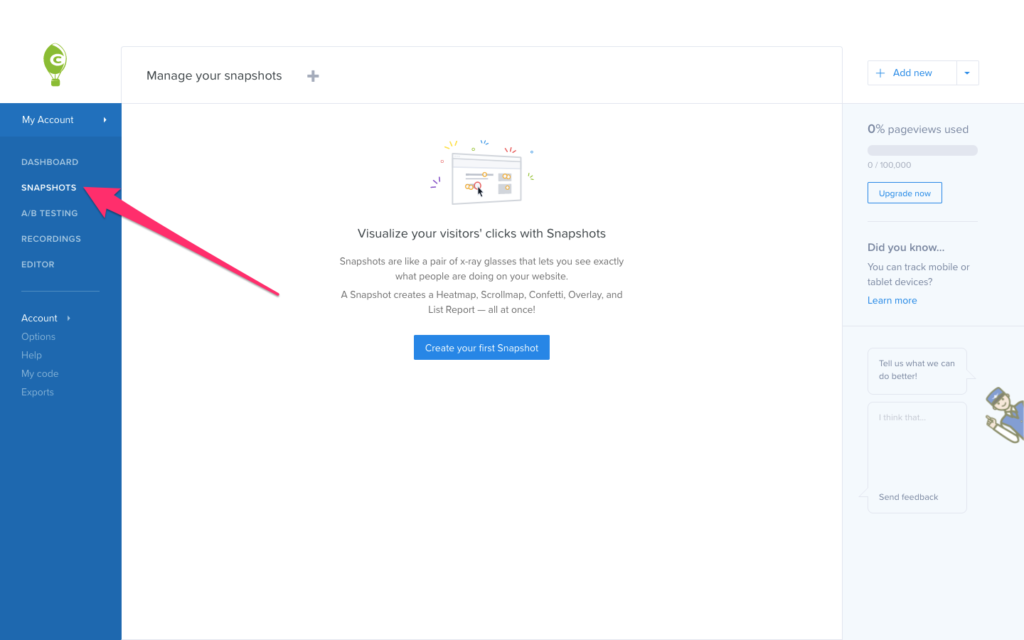
You can find these maps by clicking on Snapshots from the sidebar.
Clickmaps (aka Confetti)
Clickmaps are the kind of heatmap that will show you which areas of a web page are being clicked. This could indicate an issue with your CTA, which obviously isn’t desirable, but it also indicates areas of your UI (such as categories) that users are interested in, much to your surprise.
Consider this scenario as well: a user is trying to click on an image (let’s assume that it’s a product photo), expecting it to zoom in/expand. From this behavior, you can then decide to implement image-zooming.
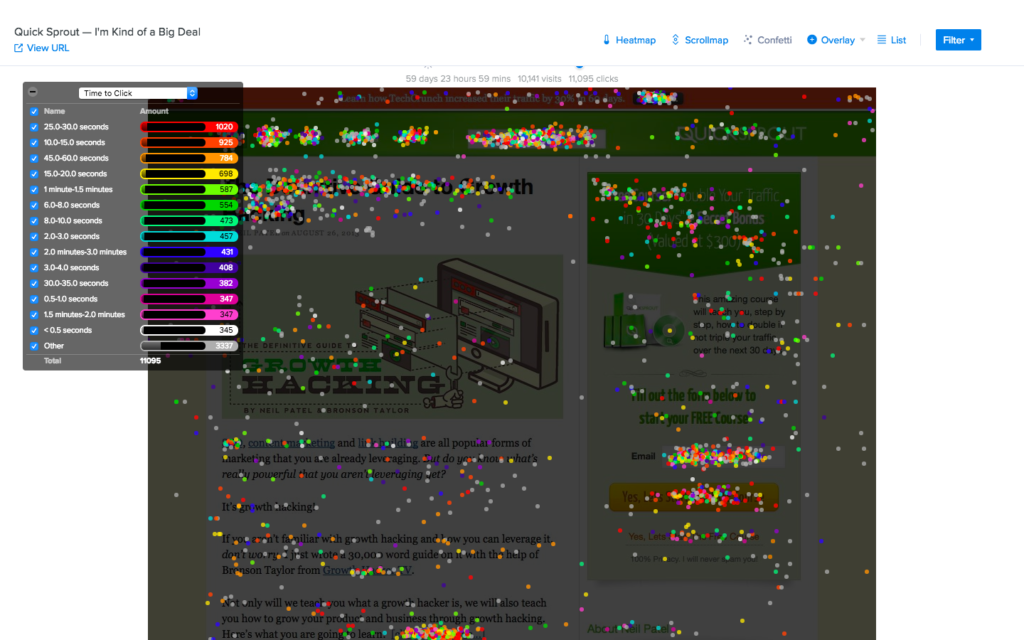
You can pair these clicks with metrics such as Time to Click.
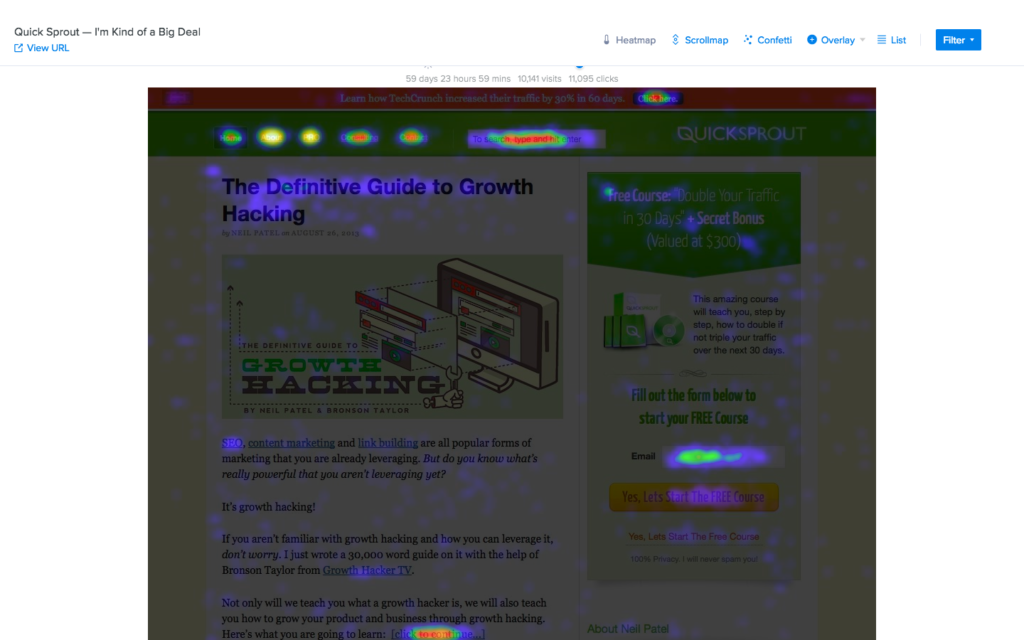
Hovermaps (aka Heatmaps)
Hovermaps, better known as heatmaps, identify those areas of the screen that users hover over the most with their actual cursor. Heatmaps will help you to understand which areas users find the most interesting, highlighting what the user intent was, even if they didn’t click in that area.
For example, let’s say that users are hovering over your navigation and expecting a third level (e.g. Mens → Smart → Shirts, where Shirts is the level that’s missing), but they aren’t clicking since your navigation only has two levels. You can then make changes based on this information.
You might also find that users are navigating between two pricing models, indicating that a cost “somewhere in the middle” might be more suitable.
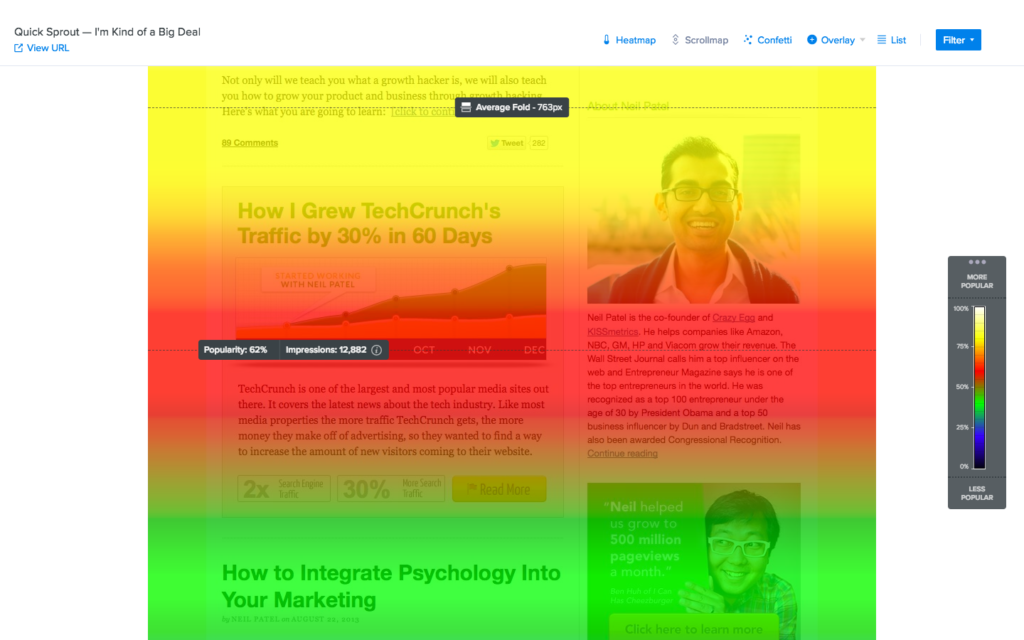
Scrollmaps
Scrollmaps will show you how far your visitors are scrolling on a web page, and in which sections they’re spending most of their time.
Scrollmaps will display this with Popularity and Impressions. This could help you to fine-tune your catalog on your ecommerce site, or rearrange the sections on your landing page, based on what sections the user is scrolling to. It could be that the most valuable content is sunk at the bottom, while the above-the-fold content isn’t getting as much attention as you originally thought. The “hot” sections will be warmer (red/orange), while the less important sections will be colder (blue/green). Generally speaking, you don’t want to make the user scroll to find your best content!
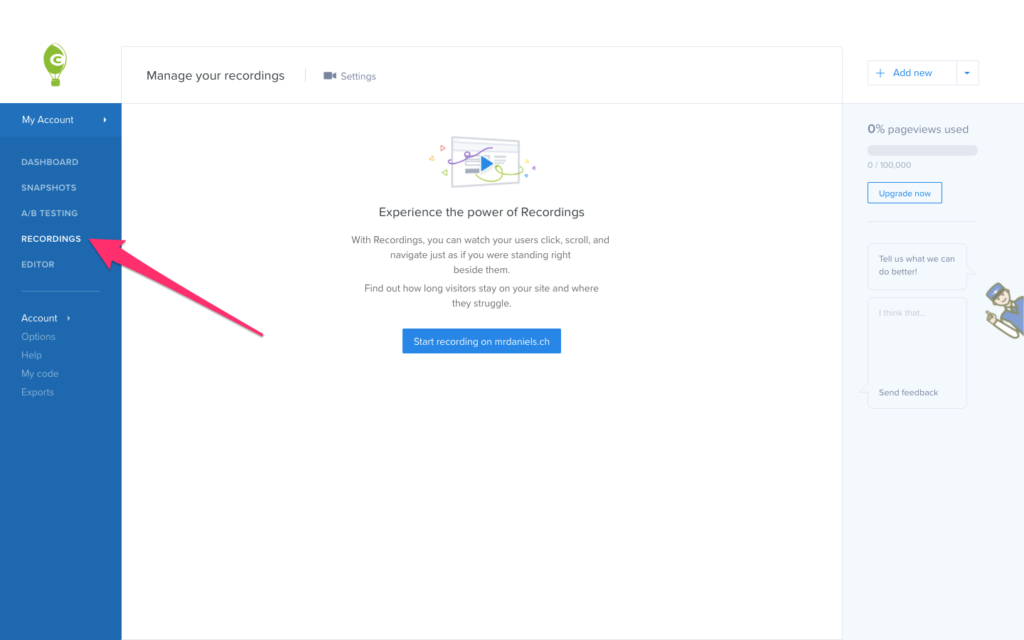
Recordings: Heatmaps for Specific Users
Can you zoom in to specific users? Yes.
Once the tracking code has been live for 30 minutes, and assuming that you’ve had website visitors in that time, navigate to Recordings from the sidebar to see every recorded version of your users’ behavior on the site. From there you can see a specific user’s Confetti, heatmap and scrollmap. Crazy Egg will record the session of every user by default.
A/B Testing: Trying Out Solutions
What happens when we’ve identified areas of concern? Do we switch to a tool that lets us test possible solutions? Nope. Crazy Egg allows us to create A/B tests as well! Let’s say that your confetti/clickmap indicates that two categories are getting clicked on more than any other categories, and we want to test whether moving those categories to the front of the navigation helps to boost conversions. With A/B testing, we can do that.
From the sidebar, click Editor. The visual Editor allows us to create variations right from within Crazy Egg, no code required.
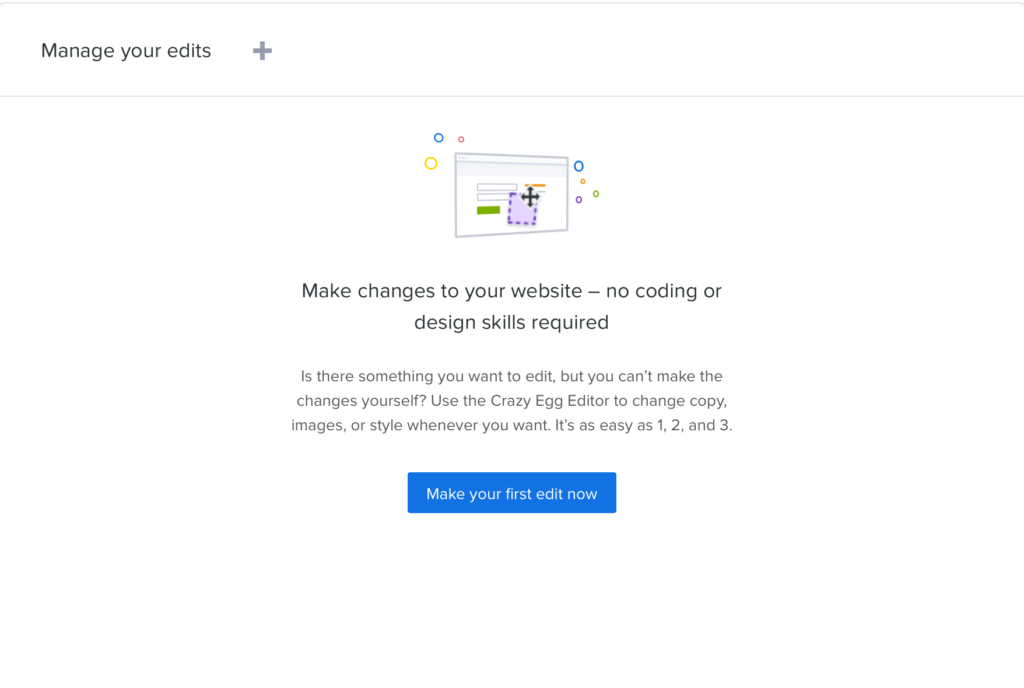
Click the Make your first edit now button, select the website that you want to edit, and then click on the device you want to experiment with. Your website will now appear. Click on an element, and from the dropdown that appears, choose which aspects of the element you want to change.
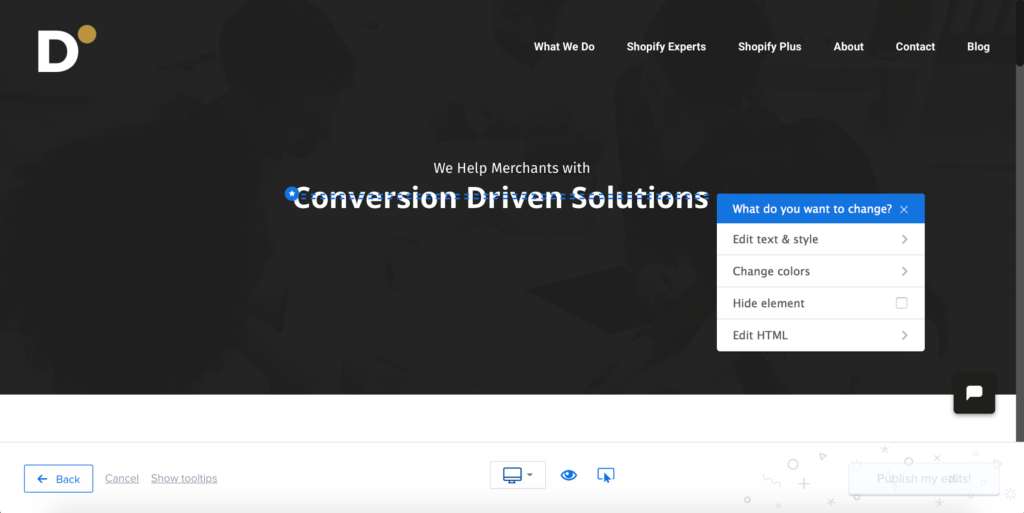
Once you’re done editing, click the Publish my edits button in the bottom-right corner, and those changes will then go live at a variant URL (for example: http://www.example.com/?variant=1). With Google Analytics segmentation, you can then determine which of the variations is converting users the most (you can create as many variations as you like), and then make a decision to apply that variation permanently.
You can also use the snapshots (confetti, heatmaps, scrollmaps) to analyze the outcome of the experiment as well.
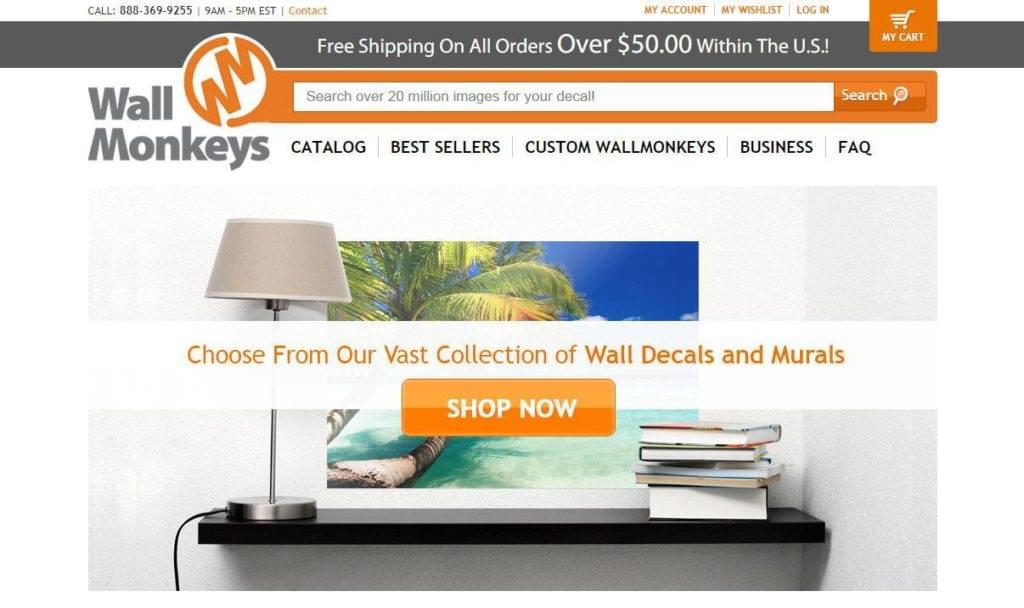
WallMonkeys: a Crazy Egg Case Study
Okay, here’s an example of an A/B test in real life — how WallMonkeys boosted their conversion rate by 550% with heatmaps and A/B testing.
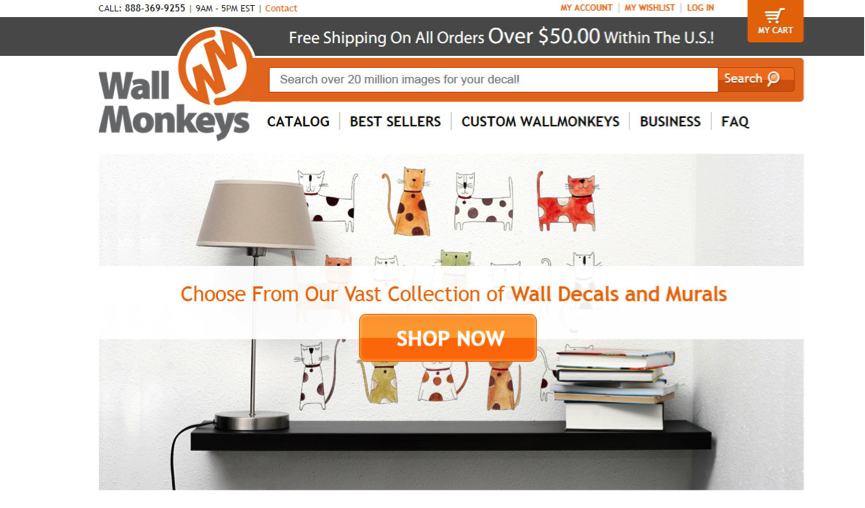
WallMonkeys knew that the first “message” and visual experience would have the greatest impact on their ecommerce conversion rate. They did some research on user behavior and UX psychology, and tried to correlate the findings with the way users were acting on their website (as depicted by the heatmaps and scrollmaps in Crazy Egg). Then they begun to A/B test various things, one change at a time. (Doing multiple changes at once will only leave you wondering what change had an effect on conversions.)
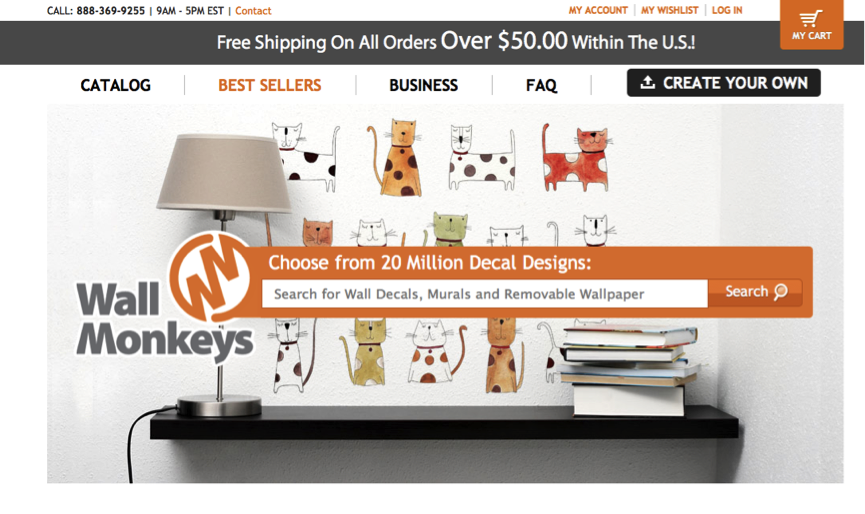
In total, there were three A/B tests. Over the course of all the A/B tests, they removed the slider that nobody was clicking on (or had shown an interest in), and made the main image look more “fun”. The menu and search bar was also made to be more visible, as Wallmonkeys had a sneaking suspicion that what users really wanted was to search for their item.
Original Variation
Variation #1: **27% increase in revenue
Variation #2: 550% increase in revenue!
Conclusion
Crazy Egg can help you to reveal the low-performing sections of your website via clickmaps, heatmaps and scrollmaps, and then you can run various A/B tests as an act of continuous UX improvement. If the WallMonkeys case study has shown us anything, it’s that there’s always room for improvement, and that improvement can’t happen all at once.
Crazy Egg has the features to help you identify poor UX, experiment with alternative experiences, and then confirm how the UX should really be.