Scalable Vector Graphics: Drawing Basics
In this article, you’ll discover the basic concepts, document structure, and drawing elements used in SVG images.
If you’re completely new to SVGs, it may help to read the following articles first:
SVG Co-ordinate Grid
An SVG is defined in whatever co-ordinate space you give it. That space does not necessarily correlate with pixels, centimeters, inches, or other absolute units, because an SVG can be scaled to any dimension.
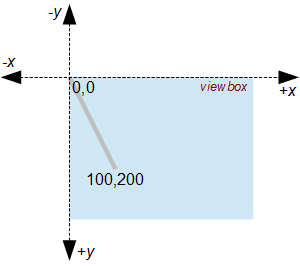
The SVG’s viewBox attribute determines the co-ordinates the image uses. The following SVGs would look identical when scaled to the same size:
- a
viewBoxof0,0to200,100with a line from0,0to100,50 - a
viewBoxof0,0to300,150with a line from0,0to150,75 - a
viewBoxof0,0to30,15with a line from0,0to15,7.5(fractions of a unit are permitted)

Unlike mathematical graphs, the SVG co-ordinate system starts at the top left (usually 0,0) with the x-axis pointing right and y-axis pointing down. Therefore, a point at 100,200 represents 100 units to the right of the left hand edge and 200 units down from the top edge.
When an SVG is rendered, it can be given width and height attributes or assigned dimensions in CSS. The image will be stretched or squashed in both directions to fill the space it’s been allocated. However, an SVG can declare that its aspect ratio can be preserved to ensure dimensions are scaled consistently.
SVG XML Document
An SVG image is an XML document which follows strict conventions (closing tags, quoted attributes, etc). When SVGs were first developed in 1999, files required an XML declaration and DOCTYPE at the top of the document above the root <svg> element:
<?xml version="1.0" encoding="UTF-8" standalone="no"?>
<!DOCTYPE svg PUBLIC "-//W3C//DTD SVG 1.1//EN" "https://www.w3.org/Graphics/SVG/1.1/DTD/svg11.dtd">
<svg xmlns="https://www.w3.org/2000/svg">

  <!-- image data -->

</svg>
You may still encounter this format, but it’s more usual for .svg files to use a single root element:
<svg xmlns="https://www.w3.org/2000/svg">

  <!-- image data -->

</svg>
The xmlns attribute is required. Most browsers will allow it to be omitted when an SVG is embedded directly in HTML, although that can lead to issues if you want to manipulate the image later:
<svg>

  <!-- image data -->

</svg>
Many optional attributes can be applied to the root element, but the most used are:
-
viewBox to set the dimensions.
A rectangular co-ordinate area is specified as
"minX minY width height". for example,viewBox="0 0 600 400"is a600by400width box with the top-left co-ordinate at0,0. Remember this is an abstract space; it doesn’t relate to pixels, and your drawing elements are not constrained within these co-ordinates. -
preserveAspectRatio defines how a viewbox is scaled.
There are many options. For example,
preserveAspectRatio="xMidYMid meet"ensures the middle of an SVG’s viewbox is aligned with the middle of the viewport (the browser window or HTML element containing the SVG) and the image fits the space available while preserving its aspect ratio. -
heightandwidthset the intrinsic image size.For example, setting
width="300" height="200"would use a default image of300by200pixels unless it was sized using CSS. If the width and height are set without setting aviewBox, the number of SVG units is presumed to be that size — that is,viewBox="0 0 300 200".
The root <svg> element can be followed by an optional title and description defined using title and desc elements. A basic document:
<svg xmlns="https://www.w3.org/2000/svg" viewBox="0 0 600 400" preserveAspectRatio="xMidYMid meet">
  <title>My First Scalable Vector Graphic</title>
  <desc>An experimental SVG from SitePoint.com</desc>

  <!-- drawing elements to go here -->

</svg>
Grouping Elements
Any set of elements (lines, circles, rectangles, text, etc.) can be grouped using <g>...</g> tags. In essence, it’s similar to grouping drawing objects in a graphics package so they can be manipulated as a single item.
For example, you could define a root group node so the whole image can be manipulated via JavaScript or CSS:
<g id="main">
  <!-- drawing elements to go here -->
</g>
A single group can have any number of inner groups with nesting as necessary.
Lines
A single line between two points is drawn using the line element:
<line x1="10" y1="10" x2="100" y2="200"
stroke="#999" stroke-width="5" stroke-linecap="round" />
The stroke-linecap attribute defines the line-end effect and accepts values of butt (the default), round, square or inherit:

Image source: w3.org
Polylines
Polylines define a set of connected straight line segments:
<polyline points="580,10 560,390 540,200 520,390 400,390"
stroke="#c00" stroke-width="5" stroke-linecap="round"
stroke-linejoin="round" fill="none" />
The stroke-linejoin attribute defines the line-joining effect and accepts values of miter (the default), round, bevel or inherit:

Image source: w3.org
Polygons
Polygons are similar to polylines except that the resulting shape will always be closed:
<polygon points="350,75 379,161 469,161 397,215 423,301 350,250 277,301 303,215 231,161 321,161"
stroke="#ff0" stroke-width="10" fill="#ff6" />
Rectangles
Square or rounded rectangles are defined using the rect element:
<rect x="100" y="10" width="150" height="100" rx="10" ry="20"
stroke="#060" stroke-width="8" fill="#0f0" />
The x and y attributes define the top-left corner. rx and ry specify the horizontal and vertical corner rounding.
Circles
Circles are defined using a center point and radius:
<circle cx="100" cy="300" r="80"
stroke="#909" stroke-width="10" fill="#f6f" />
Ellipses
Ellipses are defined using a center point and two radius values:
<ellipse cx="450" cy="50" rx="80" ry="30"
stroke="#0cc" stroke-width="10" fill="#0ff" />
Text
Basic text can be added using the text element:
<text x="240" y="390" font-family="sans-serif" font-size="50" fill="#00f">SVG</text>
The x and y attributes define the bottom-left co-ordinate of the first character in the string, although the text-anchor and dominant-baseline attributes offer more control over placement.
Paths
Finally, there is a path element which has the power to emulate any of the basic elements above. Refer to “How to Create Complex Paths in SVGs” for more details.
The Result
Our final SVG document contains the following elements:
<svg xmlns="https://www.w3.org/2000/svg" viewBox="0 0 600 400" preserveAspectRatio="xMidYMid meet">
  <title>My First Scalable Vector Graphic</title>
  <desc>An experimental SVG from SitePoint.com</desc>
  <g id="main">
    <line x1="10" y1="10" x2="100" y2="200" stroke="#00c" stroke-width="5" stroke-linecap="round" />

    <polyline points="580,10 560,390 540,200 520,390 400,390" stroke="#c00" stroke-width="5" stroke-linecap="round" stroke-linejoin="round" fill="none" />

    <polygon points="350,75 379,161 469,161 397,215 423,301 350,250 277,301 303,215 231,161 321,161" stroke="#ff0" stroke-width="10" fill="#ffc" />

    <rect x="100" y="10" width="150" height="100" rx="10" ry="20" stroke="#060" stroke-width="8" fill="#0f0" />

    <circle cx="100" cy="300" r="80" stroke="#909" stroke-width="10" fill="#f6f" />

    <ellipse cx="450" cy="50" rx="80" ry="30" stroke="#0cc" stroke-width="10" fill="#0ff" />

    <text x="240" y="390" font-family="sans-serif" font-size="50" fill="#00f">SVG</text>
  </g>
</svg>
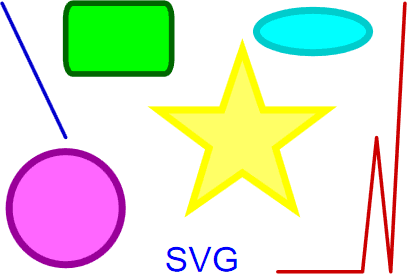
The code above renders like so:

You can download the SVG file here.
This is a simple example, but the file is less than one Kilobyte before optimization, minification, and gzipping. An equivalent compressed PNG above is almost five times larger and can’t be scaled above its native 407 by 274 resolution without losing quality.
It’s rare you need to draw SVGs manually, since it’s easier to use a graphics package such as Illustrator, Inkscape, SVG-edit, or Method Draw. However, understanding how the basic SVG elements work may help you optimize images or generate amazing images on the server or in JavaScript.
Further resources: