Display Traffic Stats From Google Analytics API
This is how you can use Google Analytics API to get traffic statistics for your website. My original aim was to get live stats and display them on the blog… but as far as I am aware Google Analytics API doesn’t support real-time stats yet… but this is still useful if you want to display pageviews or number of visits on your site and have it automatically update.
In this post
- Setup your Google Analytics API Access
- Frontend JavaScript to call backend script and display data
- Backend PHP Script to connect to Google Analytics API
- Live Working Demo
- Download Package for you to try it yourself
Setup your Google Analytics API Access
This is fairly straight forward and should only take 2 minutes. Go to https://code.google.com/apis/console/.
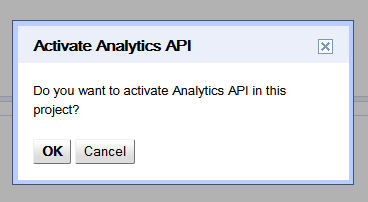
Activate analytics api for your project.
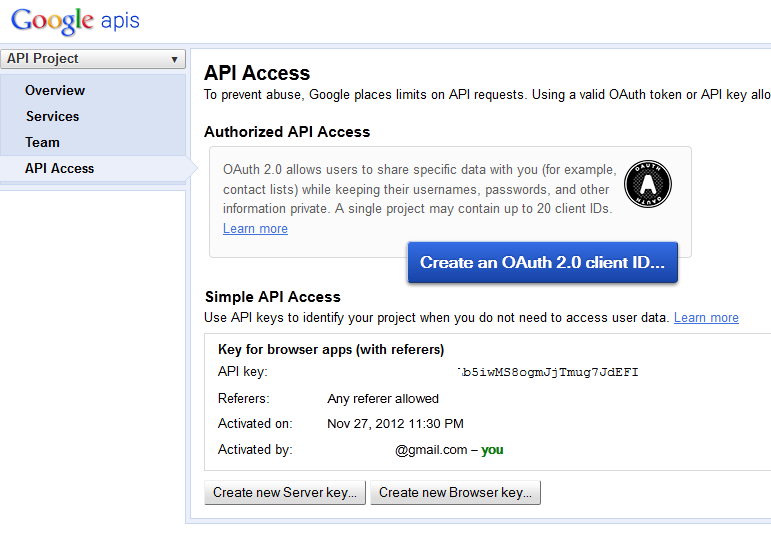
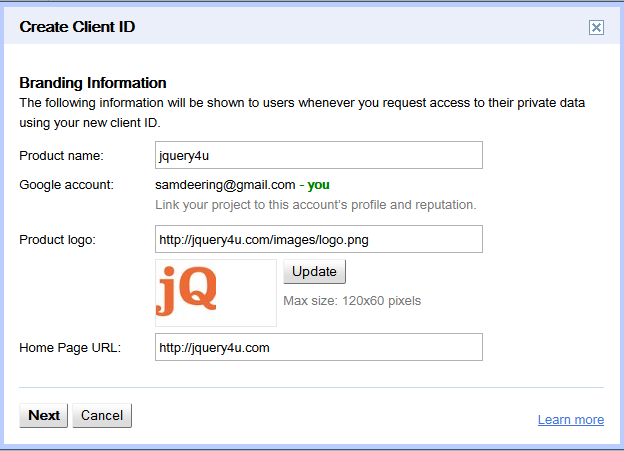
Create a new oAuth 2.0 client (click the big blue button…)
Make sure the Google Analytics Service is switched on.
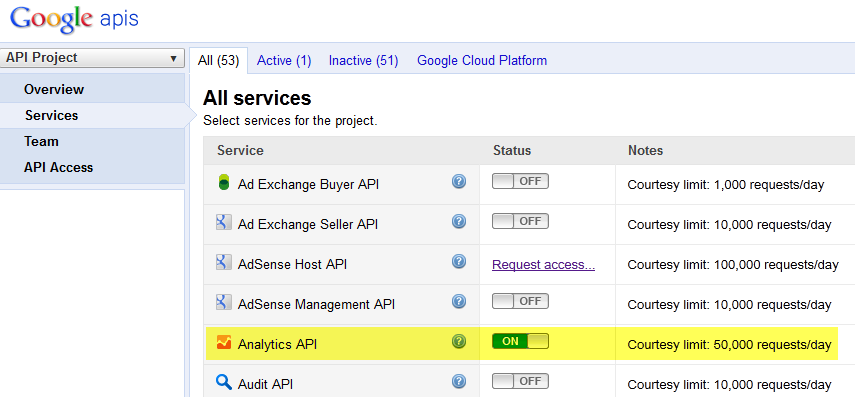
Your screen should now look something like this:
The Frontend Script
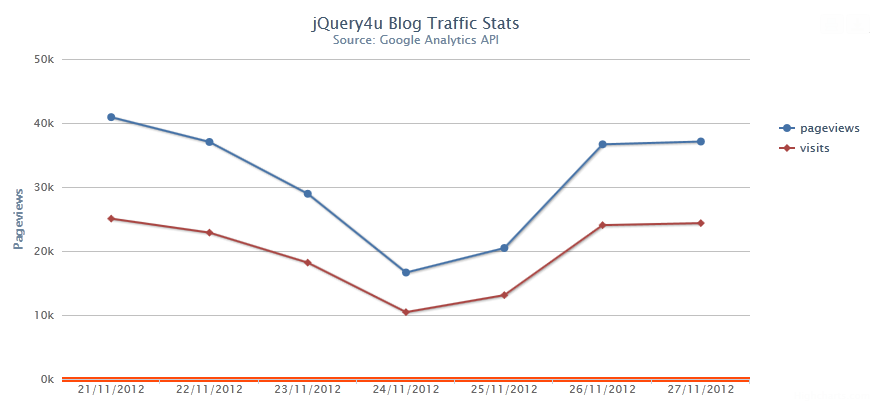
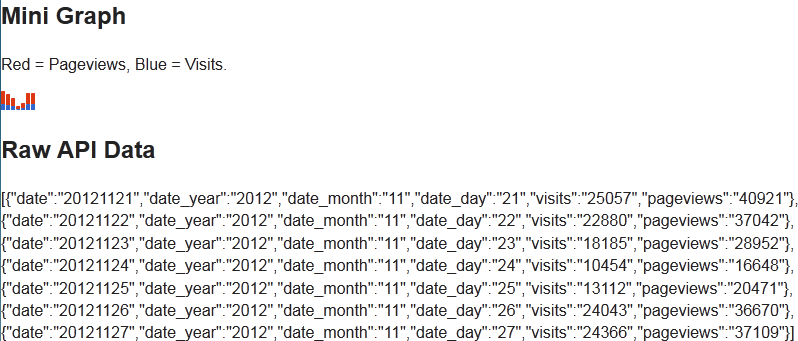
This script basically makes an ajax request to the backend script and then parses the JSON data to create the graphs.
/*
    Author: Sam Deering 2012
    Copyright: jquery4u.com
    Licence: MIT.
*/
(function($)
{

    $(document).ready(function()
    {

        //loading image for ajax request
        var $loading = $('#galoading');
        $.ajaxSetup(
        {
            start: function()
            {
                $loading.show();
            },
            complete: function()
            {
                $loading.hide();
            }
        });

        $.getJSON('data.php', function(data)
        {
            // console.log(data);
            if (data)
            {
                $('#results').show();

                //raw data
                $('#gadata').html(JSON.stringify(data));

                //mini graph
                var miniGraphData = new Array();
                $.each(data, function(i,v)
                {
                     miniGraphData.push([v["visits"], v["pageviews"]]);
                });
                // console.log(miniGraphData);
                $('#minigraph').sparkline(miniGraphData, { type: 'bar' });

                //get graph data
                var xAxisLabels = new Array(),
                    dPageviews = new Array(),
                    dVisits = new Array();
                $.each(data, function(i,v)
                {
                     xAxisLabels.push(v["date_day"]+'/'+v["date_month"]+'/'+v["date_year"]);
                     dPageviews.push(parseInt(v["pageviews"]));
                     dVisits.push(parseInt(v["visits"]));
                });
                console.log(xAxisLabels);
                console.log(dPageviews);
                console.log(dVisits);

                var chart = new Highcharts.Chart({
                    chart: {
                        renderTo: 'graph',
                        type: 'line',
                        marginRight: 130,
                        marginBottom: 25
                    },
                    title: {
                        text: 'jQuery4u Blog Traffic Stats',
                        x: -20 //center
                    },
                    subtitle: {
                        text: 'Source: Google Analytics API',
                        x: -20
                    },
                    xAxis: {
                        categories: xAxisLabels
                    },
                    yAxis: {
                        title: {
                            text: 'Pageviews'
                        },
                        plotLines: [{
                            value: 0,
                            width: 5,
                            color: '#FF4A0B'
                        }]
                    },
                    tooltip: {
                        formatter: function() {
                                return ''+ this.series.name +'
'+
                                this.x +': '+ this.y.toString().replace(/B(?=(d{3})+(?!d))/g, ",") +' pageviews';
                        }
                    },
                    legend: {
                        layout: 'vertical',
                        align: 'right',
                        verticalAlign: 'top',
                        x: -10,
                        y: 100,
                        borderWidth: 0
                    },
                    series: [
                    {
                        name: 'pageviews',
                        data: dPageviews
                    },
                    {
                        name: 'visits',
                        data: dVisits
                    }]
                });


            }
            else
            {
                $('#results').html('error?!?!').show();
            }
        });

    });

})(jQuery);
The Backend PHP Script
This script connects to Google Analytics API and grabs the data associated with your project (website).
setAccessType('online'); // default: offline
$client->setApplicationName('[INSERT YOUR APP NAME HERE]');
$client->setClientId('[INSERT YOUR KEY HERE]');
$client->setClientSecret('[INSERT YOUR KEY HERE]');
$client->setRedirectUri($scriptUri);
$client->setDeveloperKey('[INSERT YOUR KEY HERE]'); // API key

// $service implements the client interface, has to be set before auth call
$service = new Google_AnalyticsService($client);

if (isset($_GET['logout'])) { // logout: destroy token
    unset($_SESSION['token']);
    die('Logged out.');
}

if (isset($_GET['code'])) { // we received the positive auth callback, get the token and store it in session
    $client->authenticate();
    $_SESSION['token'] = $client->getAccessToken();
}

if (isset($_SESSION['token'])) { // extract token from session and configure client
    $token = $_SESSION['token'];
    $client->setAccessToken($token);
}

if (!$client->getAccessToken()) { // auth call to google
    $authUrl = $client->createAuthUrl();
    header("Location: ".$authUrl);
    die;
}

try {

    //specific project
    $projectId = '[INSERT PROJECT ID HERE]'; //see here for how to get your project id: http://goo.gl/Tpcgc

    // metrics
    $_params[] = 'date';
    $_params[] = 'date_year';
    $_params[] = 'date_month';
    $_params[] = 'date_day';
    // dimensions
    $_params[] = 'visits';
    $_params[] = 'pageviews';

    //for more metrics see here: http://goo.gl/Tpcgc

    // $from = date('Y-m-d', time()-2*24*60*60); // 2 days ago
    // $to = date('Y-m-d'); // today
    $from = date('Y-m-d', time()-7*24*60*60); // 7 days ago
    $to = date('Y-m-d', time()-24*60*60); // 1 days ago

    $metrics = 'ga:visits,ga:pageviews,ga:bounces,ga:entranceBounceRate,ga:visitBounceRate,ga:avgTimeOnSite';
    $dimensions = 'ga:date,ga:year,ga:month,ga:day';
    $data = $service->data_ga->get('ga:'.$projectId, $from, $to, $metrics, array('dimensions' => $dimensions));

    $retData = array();
    foreach($data['rows'] as $row)
    {
       $dataRow = array();
       foreach($_params as $colNr => $column)
       {
           $dataRow[$column] = $row[$colNr];
       }
       array_push($retData, $dataRow);
    }
    // var_dump($retData);
    echo json_encode($retData);


} catch (Exception $e) {
    die('An error occured: ' . $e->getMessage()."n");
}
?>
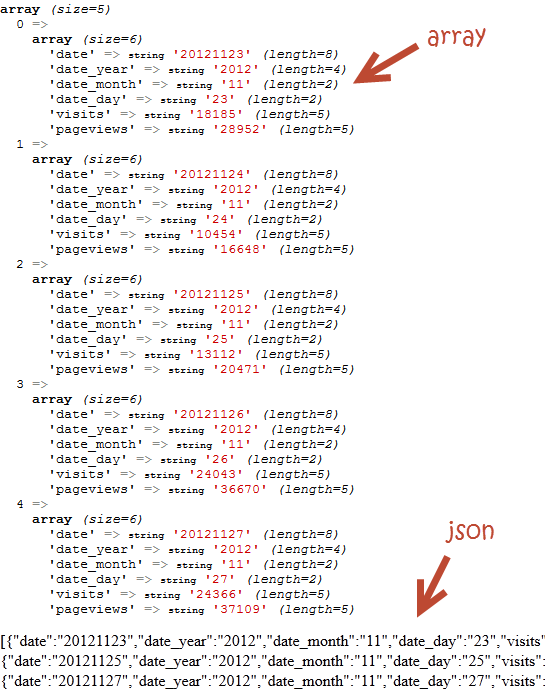
The script in debug:
Demo
From time to time, SitePoint removes years-old demos hosted on separate HTML pages. We do this to reduce the risk of outdated code with exposed vulnerabilities posing a risk to our users. Thank you for your understanding.
You’ll need permission to view the demo. I’ll hook up a public demo soon.

